Building blast-audit: AWS attack path visualizer in the browser (no Neo4j, no Docker)
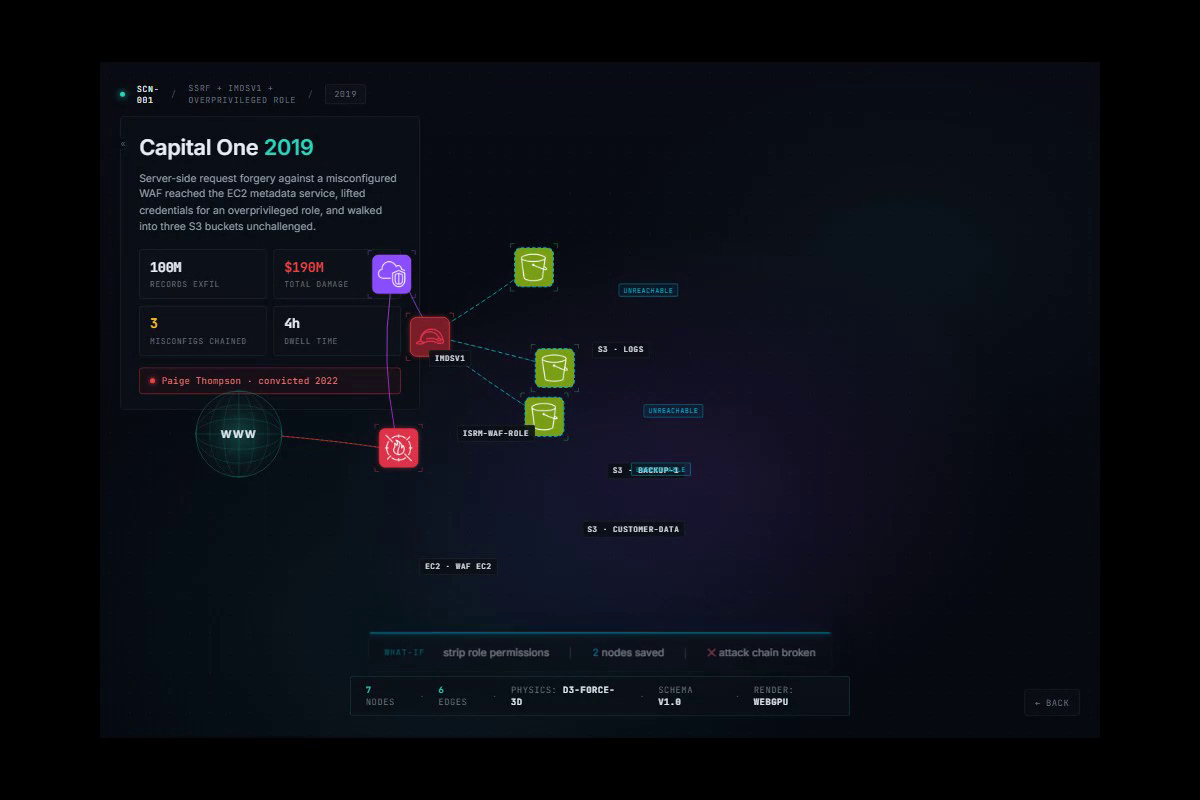
TL;DR: I built blast-audit, an in-browser AWS attack path visualizer that consumes cloud-audit JSON. 5 public incident/campaign scenarios and 2 research scenarios are pre-loaded - from Capital One 2019 to AgentCore 2026 research. The break-point algorithm fits in roughly 110 lines of TypeScript in the current implementation. There is a wire-format contract (BlastRadiusGraph v1.0) between the CLI scanner and the viewer. Honestly: not first, not Wiz killer. BloodHound CE, Cartography, AWSPX, and the Prowler App all exist and do important things blast-audit deliberately does not. This post is the architecture, the algorithm, and a candid landscape comparison.
Disclosure: I am the author of both cloud-audit (MIT, on PyPI) and blast-audit (browser visualizer at blast-audit.haitmg.pl). This post describes the tools I built and uses them as the reference implementation. The competitive landscape section was verified against primary sources in May 2026.
Why a browser-based visualizer at all?
Several commercial and open-source attack-path tools already exist, and they all do things blast-audit cannot:
- Wiz has Toxic Combinations and Attack Path Analysis, now part of Google Cloud (Wiz was acquired by Google in March 2026). Paid, enterprise.
- Orca Security has had Attack Path Analysis since March 2022 and is one of the few vendors that uses the term “blast radius” explicitly in their product copy. The phrase predates me.
- BloodHound Community Edition v8 added OpenGraph in July 2025, enabling ingestion of attack-path data beyond the traditional AD/Entra model. SpecterOps uses OpenGraph to extend attack-path management into platforms such as AWS, Azure, GitHub, Okta, and Jamf. Apache 2.0. One of the reference points for graph-based identity attack-path work.
- Cartography (transferred from Lyft to CNCF Sandbox in 2024, Apache 2.0) is a widely used Python plus Neo4j data layer for cloud asset graphing and security analysis.
- AWSPX (FSecure, now ReversecLabs) is Python plus Neo4j plus Vue plus Cytoscape, AWS-focused graph pentesting.
- PMapper (NCC Group, AGPL v3) is IAM principal mapping in a directed graph - last release predates 2024.
Most open-source graph workflows in this space require local or hosted infrastructure. BloodHound CE wants Docker, Postgres, and Neo4j. Cartography wants Neo4j. AWSPX wants Neo4j and a frontend stack. The Prowler App is open source and self-hostable too, with its own deployment model. None of them runs from a URL on a phone in a meeting.
The shape I wanted: engineer hits a URL, drops a scan JSON, sees the chain in 5 seconds, shows the CFO the same view with money instead of technique IDs. That is the niche.
That niche has cost: blast-audit cannot query across 200K AD nodes (BloodHound can), cannot ingest from EKS or Okta (Cartography can), cannot run on a corporate network without internet (none of them needs internet for analysis, only for ingest). I traded power for setup time. For the use case I had - a security review where I want to show somebody what an attack chain looks like before they decide whether to fund the remediation - the trade was worth it.
Architecture: cloud-audit → BlastRadiusGraph v1.0 → blast-audit
The hard part of any visualizer is not the rendering. It is the input contract. If the scanner emits one shape today and a different shape next quarter, the viewer is permanently broken. I wanted a wire format that:
- Could be produced by any scanner that maps AWS findings into a graph
- Survived schema evolution (versioned, backwards-compatible)
- Carried enough context to render a meaningful step-by-step story, not just nodes and edges
The result is BlastRadiusGraph v1.0, defined in TypeScript in src/types/blast-radius.ts:
export interface BlastRadiusGraph {
  schema_version: '1.0';
  scan_metadata: {
    account_id: string;
    region: string;
    timestamp: string;
    seed_resource: SeedResource;
  };
  nodes: BlastRadiusNode[];
  edges: BlastRadiusEdge[];
  narrative: NarrativeStep[];
  fixes: Fix[];
  cloud_audit_detects: CloudAuditDetection[];
}

export interface BlastRadiusNode {
  id: string;
  type: 'identity' | 'compute' | 'storage' | 'network' | 'secret'
      | 'data' | 'service' | 'external' | 'impact';
  label: string;
  status?: 'external' | 'compromised' | 'reachable'
         | 'exfiltrated' | 'impact' | 'safe';
  bfsStep?: number;     // column hint for layered layout
  attributes?: Record<string, unknown>;
  codeExample?: { language: string; title: string; content: string };
  actionTitle?: string;
  actionDescription?: string;
}

export interface BlastRadiusEdge {
  source: string;
  target: string;
  type: 'iam_assume' | 'iam_action' | 'network_route'
      | 'service_instance' | 'data_access' | 'trust';
  label?: string;
  breakpoint?: {
    impact: number;     // nodes saved by cutting this edge
    fixLabel?: string;
    fixId?: string;
  };
}
The key design decisions:
camelCase, not snake_case. Yes, this is a Python tool emitting JSON for a TypeScript consumer. The consumer drives the shape. cloud-audit’s pyproject.toml has a per-file ruff exemption documenting the trade-off so it does not get “fixed” by a future contributor.
Optional bfsStep field. When cloud-audit’s correlation engine knows the attack-chain step ordering, it emits it. The layout function uses it as a column hint for left-to-right placement. When it is missing, the layout layer falls back to a Kahn-style toposort.
Embedded codeExample per node. This is what turns a node-and-edge diagram into a step-by-step walkthrough. The visualizer’s step panel renders the code with per-language syntax highlighting (HTTP, JSON, BASH, HCL, Python). The cloud-audit CLI populates these from incident-inspired and research-backed attack-chain templates: the SSRF payload for Capital One, the leaked-key validation and aws s3 sync access example for the synthetic Cryptomining 2025 chain, the role-trust JSON for the AgentCore research scenario.
breakpoint metadata on edges. This is the hook that lets the UI light up “cut this one edge and the chain shortens by N nodes.” More on the algorithm in the next section. The metadata is optional - if the producing scanner does not know which edges are choke points, the visualizer computes them client-side instead.
cloud_audit_detects. Each finding ID in this list (for example aws-iam-007, aws-ec2-006) maps back to a cloud-audit check. This is what closes the loop between “you have an attack chain” and “here is the specific configuration that creates it, with copy-paste remediation.”
The CLI is documented at haitmg.pl/cloud-audit/features/blast-radius/. Concrete example:
# Pure CLI: walk outward from a single EC2 instance, get the chain as JSON
cloud-audit blast-radius --resource i-0123456789abcdef0 \
  --format json --max-depth 5 --max-nodes 50 \
  --output instance-blast.json

# Then drag-drop instance-blast.json onto blast-audit.haitmg.pl/demo/upload/
Seed resource types supported in v2.3.0: EC2 instance, IAM Role, IAM User, Lambda function, S3 bucket, Secrets Manager secret. Each has its own expansion rule (compute looks up attached IAM role first, identity looks up AssumeRole graph and admin escalation paths). Pure in-memory analysis against a saved scan: zero AWS API calls at blast-radius time.
The break-point algorithm: edge-removal BFS in ~110 lines
The visual centerpiece of blast-audit is the break-point overlay: a toggle that dims the graph, highlights specific edges in pulsing red, and says “cut this one and the attack chain collapses.”
Conceptually this is a small, local version of the choke-point idea that commercial CNAPP tools expose as attack-path or toxic-combination views (Wiz’s “Toxic Combinations”, Orca’s “Choke Point Detection”). It is not a reimplementation of those products’ internals - they run continuous inventory graphs across an entire fleet, with policy engines, prioritization, runtime enrichment, identity, exposure, secrets, and vulnerability context layered in. blast-audit’s algorithm is a deterministic edge-removal reachability test for one snapshot graph, in the browser, on one scan at a time. Different scope; same intuition about which edge is the choke point.
In src/lib/transform/breakpoints.ts:
export function computeBreakpoints(
  scan: BlastRadiusGraph
): Map<string, BreakpointInfo> {
  const entryPoints = scan.nodes
    .filter(n => n.status === 'external')
    .map(n => n.id);

  // Fallback: nodes with no incoming edges count as entry points
  if (entryPoints.length === 0) {
    const incoming = new Set(scan.edges.map(e => e.target));
    for (const node of scan.nodes) {
      if (!incoming.has(node.id)) entryPoints.push(node.id);
    }
  }

  const baseline = bfs(scan.nodes, scan.edges, entryPoints);
  const result = new Map<string, BreakpointInfo>();

  for (const edge of scan.edges) {
    const without = scan.edges.filter(e => e !== edge);
    const reach = bfs(scan.nodes, without, entryPoints);
    const delta = baseline.size - reach.size;
    if (delta >= 2) {
      result.set(edgeKey(edge), {
        impact: delta,
        ...fuzzyMatchFix(edge, scan.fixes),
      });
    }
  }

  return result;
}
What this is doing:
- Find the entry points. External-status nodes (internet, leaked credentials, supply-chain compromise). Fall back to in-degree-zero nodes if none are explicitly tagged.
- Compute baseline reach. Forward BFS from entry points across the full graph. This is the set of resources currently reachable by an attacker.
- Per-edge simulation. For each edge, temporarily remove it, re-run BFS, count the delta of newly unreachable nodes.
- Filter. Edges with delta less than 2 are noise. Edges with delta of 2 or more are real choke points - cutting them shortens the chain.
- Fuzzy-match against fixes. Each cloud-audit finding can carry a
breaks_chain=trueflag. The algorithm tries to match the edge label against the fix’s title to surface the actual remediation in the UI.
The complexity is O(E * (V + E)). In my local benchmarks on typical scans (under 50 nodes, under 100 edges), this runs in single-digit milliseconds in the browser, no Web Worker needed. The visualizer caps at 50 nodes per scan by design, so the brute-force complexity does not bite in practice.
The output is a Map keyed by edge that the UI consumes to:
- Render those edges in pulsing red with flowing dashes (CSS animation, no JS in the hot path)
- Add a red ring around target nodes (the resources saved by cutting)
- Dim everything else to 0.18 opacity so the eye is drawn to the choke points
- Show a hover tooltip “BREAK POINT / Cut this edge → N nodes unreachable / Fix: Force IMDSv2 on all EC2 instances”
- Mark the corresponding step tab in the right-hand code panel with a red corner dot
For the sample IAM role privesc fixture (8 nodes, 7 edges), the algorithm auto-detects 4 break-points with impacts 7, 6, 5, and 2. The number-one break-point is dev-mblake user to readonly role - cut that one edge and 7 downstream nodes become unreachable. That is exactly the kind of finding that should drive a P0 fix.
Why 2D DOM instead of Three.js
The first version of the visualizer was Three.js plus WebGPU plus d3-force-3d. Real 3D nodes, real bloom passes, real OrbitControls. It looked spectacular at 60fps. In my own measurements it also took roughly 12 seconds to first paint on a midrange laptop and burned the CPU. The 3D was an aesthetic, not a feature.
I deleted it.
The current scene is 2D DOM authored at 1920x1080 reference space, scaled via CSS transform:
.scene-layer {
  position: absolute;
  top: 50%;
  left: 50%;
  width: 1920px;
  height: 1080px;
  transform: translate(-50%, -50%) scale(var(--scene-scale));
  transform-origin: center center;
}
A JavaScript helper sets --scene-scale based on the available viewport width and the panel reserve (the right-hand code panel is 380px wide, so the usable scene area is viewport - 380 - 44). The same scene renders identically from 1366x768 up to 2560x1440, and the math is one CSS variable update.
Nodes are 96x96 absolute-positioned <div> elements with backgrounds set to AWS service icons (16 icons covering Lambda, Bedrock AgentCore, ECS, ASG, WAF, VPC, S3, IAM, Secrets Manager, GuardDuty, RDS, and the WWW globe internet node). Edges are SVG bezier paths in a single <svg> overlay, with gradient defs and an optional glow filter. In the current implementation, the whole scene markup is under ~8KB of HTML plus CSS before icons load.
The 3D version was 600KB of WebGPU shader strings.
7 public incident and research scenarios: methodology + sources
The educational value of attack path visualization is not in the syntax of the graph. It is in walking through breaches and campaigns that actually happened, plus a small number of pre-disclosure research scenarios that model where attacks are heading next. blast-audit ships 7 pre-loaded scenarios: 5 are public incidents or campaign clusters, 2 are research scenarios based on published vendor disclosures. Each one cites primary sources in src/data/threat-actors.ts:
Capital One 2019 - SSRF against a misconfigured ModSecurity WAF, IMDSv1 token harvest, lateral to over-permissioned isrm-waf-role, walked into 3 S3 buckets unchallenged. Approximately 100M records affected. Public timeline: unauthorized access March 22-23 2019, internal discovery July 19 2019 (roughly 118 days to detect), public disclosure July 29 2019. Costs are reported in tranches and should not be blended into one number: 80M USD OCC civil penalty, 190M USD class-action settlement, plus separately reported incident response and remediation costs. Paige Thompson convicted by jury June 2022. Source: court filings, OCC consent order, Capital One investor disclosures.
Cryptomining 2025 (synthetic chain inspired by public campaigns) - this scenario is not one named incident. It is a generalized chain inspired by the late-2025 AWS cryptomining campaign cluster (AWS-documented use of compromised IAM credentials to spin up EC2/ECS compute) plus the well-known leaked-key validation pattern, where TruffleHog-style scanners call sts:GetCallerIdentity from a distinctive user agent right after harvesting a key. The chain it visualizes - leaked key, identity validation, over-permissioned IAM role with compute-spawning permissions, multi-region instance fan-out - is consistent with public IR reports of that period, but specific TTPs in the scenario (exact API combinations, instance types) are chosen for teaching value, not pulled from one source.
Snowflake UNC5537 2024 - infostealer malware on non-Snowflake-owned systems (customer or contractor endpoints) harvested Snowflake credentials. Some of those credentials had been exposed months or years before the campaign. Attackers used them to log in where MFA was not enforced and exfiltrated data from roughly 165 customer orgs. Mandiant analysis cited approximately 79.7% of compromised accounts as having had credentials pre-exposed before the campaign. Mandiant attribution to UNC5537, Connor Moucka named in DOJ complaint. Source: Mandiant blog.
Codefinger SSE-C Jan 2025 - attackers used legitimate AWS S3 server-side encryption with customer-provided keys (SSE-C) to encrypt victim buckets, then demanded ransom for the key. No AWS vulnerability - this is abuse of a documented S3 feature after long-term access keys were compromised through other means. AWS communications emphasized the root cause was credential compromise, not an S3 flaw. Source: Halcyon research. Boardroom data labels this “Unrecoverable” because there is no public dollar figure attached.
UNC6426 / Nx supply chain 2025→2026 - Google Cloud Threat Horizons H1 2026 describes a supply-chain case tied to compromised Nx/QUIETVAULT packages. The chain reported by Google: developer endpoint infected via the compromised package, GitHub Personal Access Token stolen from the developer environment, subsequent abuse of a GitHub-to-AWS OIDC trust relationship plus over-permissioned AWS role assumptions, escalation to a role with AdministratorAccess and reach into AWS data within roughly 72 hours. This is not a simple npm typosquat - the value the visualizer adds is showing how a single stolen PAT walks into AWS through OIDC trust.
Trivy/TeamPCP Mar 2026 - compromise of official Trivy distribution paths, not a copycat action. The published advisories describe malicious Trivy releases, force-pushed GitHub Action tags (trivy-action, setup-trivy), and tampered container images flowing through legitimate channels - which is why workflows that already trusted those tags executed the payload without any new action being added. The payload targeted pipeline secrets and cloud credentials available to the workflow context; in AWS-heavy environments this can include OIDC-derived access paths and other credentials the workflow can reach. Aqua disclosed as GHSA-69fq-xp46-6x23, Microsoft published a March 24 2026 supply-chain analysis covering the same campaign.
AgentCore 2026 (research scenario, not a confirmed customer breach) - prompt injection against Amazon Bedrock AgentCore in which untrusted content reaches the agent’s planner, the planner emits an outbound DNS query to an attacker-controlled domain via the sandbox resolver, and tagged secrets exfiltrate through DNS tunneling. The scenario is built on top of public vendor research: Unit 42 “Cracks in the Bedrock” covering AgentCore sandbox isolation and DNS exfiltration paths (April 2026), plus subsequent BeyondTrust analysis that was updated after AWS shipped documentation and runtime changes. BeyondTrust notes that the DNS-based exfiltration path is no longer viable after AWS remediations. This scenario is in the visualizer for teaching purposes - to walk an engineer or a CISO through what the chain would have looked like - not to claim an active or post-mortem incident. Boardroom data is conservative: “Pre-disclosure / research” instead of a dollar value.
For each scenario, blast-audit’s ?board=1 URL parameter switches into Boardroom Mode, hiding the cyberpunk HUD and surfacing three executive tiles: exposure dollar value (where verified), time-to-detect, and fix complexity. Plus a one-paragraph executive narrative and a “Friday ask” - the question a security lead should put in front of their leadership team this week. The Print briefing button generates a one-page A4 PDF with the same content, formatted for a real boardroom handout.
Boardroom mode: when a CFO is in the room
This was the feature I almost did not build, and it is the one that ended up mattering most for actual consulting work.
A scene full of red animated dashes and 96x96 service icons is exciting for an engineer. For a CFO it is noise. The same chain in Boardroom Mode reads:
Capital One, 2019. A web application firewall misconfiguration let an attacker query the EC2 instance metadata service over its own access. The token harvested let them assume an over-permissioned IAM role, walk into three S3 buckets, and exfiltrate roughly 100 million customer records.
Exposure: 80M USD OCC civil penalty + 190M USD class-action settlement + separately reported response and remediation costs. Time to detect: ~118 days between unauthorized access (Mar 22-23 2019) and internal discovery (Jul 19 2019); ~128 days to public disclosure (Jul 29 2019). Fix complexity: Low - enforce IMDSv2, scope the IAM role.
Ask your team this Friday: “Have we forced IMDSv2 on every EC2 instance in the account? Show me the cloud-audit scan.”
That is the same scan. Different audience. The toggle takes one URL parameter and zero data conversion: the executive narrative, exposure number, and Friday ask are fields on the same scenario object that drives the technical view.
The “What stops this attack?” button on Boardroom view triggers the existing counterfactual permstrip - the same code that powers the technical break-point overlay. The exposure tile counts down from $X to $0 while the scene visualizes the unreachable nodes. The “Audit my environment” button opens Cal.com aws-triage with pre-filled scenario context. The “Download briefing” button calls window.print() against a dedicated .print-briefing CSS block that renders the same content as a 1-page A4 PDF.
The lesson: the same underlying graph data can serve two audiences if you separate the rendering from the narrative.
What blast-audit is not (honest limitations)
I want to be specific about this because the existing post on open-source AWS scanners has gotten me email like “is blast-audit the open-source Wiz killer?” It is not. Here is what it is not:
Not first. BloodHound CE, Cartography, AWSPX, PMapper, and the Prowler App all do attack path analysis in open source. Orca documented the term “blast radius” in their product copy before I picked the name. The novelty in blast-audit is the shape (in-browser, single-scan focused, educational scenarios), not the concept.
Not a Wiz replacement. Wiz Toxic Combinations operates on continuous cloud inventory across an entire fleet, with policy engines and prioritization that take significant infrastructure to replicate. blast-audit shows you one scan, on one account, at one moment in time, in a browser tab.
Not a graph database. If you have 10K+ nodes or want to write 50 Cypher queries against your AWS inventory, use BloodHound CE or the Prowler App. blast-audit caps at 50 nodes per scan by design - the visualization breaks down past that point regardless of how powerful the algorithm is.
Not multi-cloud. AWS only. The cloud-audit roadmap has GCP and Azure on it, but the schema, the icon library, and the attack-chain rules are AWS-shaped today.
Not continuous monitoring. blast-audit consumes a snapshot. cloud-audit’s diff command lets you compare two scans, but neither tool watches your account in real time.
Not the blast-audit repo. The cloud-audit CLI is MIT and on GitHub at gebalamariusz/cloud-audit. The blast-audit visualizer source is currently a private side project. The live tool is free to use; the source is not published. If you want to produce a compatible BlastRadiusGraph JSON from a different scanner, the schema is documented in TypeScript in the cloud-audit-demo src/types/blast-radius.ts (the path is preserved even though the repo is private, because the schema is also embedded in cloud-audit’s docs site at the URL above).
Where blast-audit fits in a workflow
The shape that actually shipped for me in the last three weeks:
- Discovery call with a prospect. I open blast-audit.haitmg.pl on my laptop, walk through Capital One in Boardroom Mode. The chain takes 90 seconds to narrate.
- Engagement starts. I run
cloud-audit scanagainst their account (or--role-arncross-account if that is how the engagement is shaped). In my test accounts and the small-to-medium engagements I have run, the scan completes in under 60 seconds; very large multi-region accounts will take longer. - Findings triage. The cloud-audit CLI output groups findings by root cause. For the top 1-3 chains, I run
cloud-audit blast-radius --resource <id> --format jsonto get a focused graph for each chain. - Visualization. Drop the JSONs into blast-audit. Each scan gets a slug, gets saved to localStorage, and lands as a tab in the dropdown next to the historical scenarios. Hover toggle the break-point overlay.
- Executive readout. Same scan, switch to
?board=1. Print the briefing PDF for the report deliverable.
Total tool count: one CLI (pip install cloud-audit), one browser tab.
What is next
The cloud-audit v2.3.0 release shipped the blast-radius CLI plus 9 SEC fixes and 6 follow-up fixes from the pre-release security audit. blast-audit ships the visualization. Both are stable.
Open items I am working on:
- Counterfactual mic drop: betweenness centrality scoring to auto-identify the top 1-3 choke points per scan (currently break-points are O(E * (V+E)) brute force, betweenness gives a more principled ranking)
- Multi-cloud schema extension: GCP service accounts, project-level IAM, GKE workload identity
- Shareable URL hash state: encode the scenario, board mode, and counterfactual state in a URL hash so a Slack message can carry a full view to a colleague
If you have feedback - especially on the wire format if you are building scanner integrations - I read every email at hello@haitmg.pl and every GitHub issue at gebalamariusz/cloud-audit.
If you want me to walk through your AWS account with cloud-audit and blast-audit, book an aws-triage call - 20 minutes, free, your data, no signup, no Docker, no Neo4j.
Try it now: blast-audit.haitmg.pl.